
The Hidden Costs of Commodity ETFs
Commodity ETFs, such as the United States Oil Fund (USO), promise easy exposure to raw materials, but few investors realize that these funds face a relentless drain from roll costs. Every month, these ETFs must sell expiring futures contracts and buy new ones to maintain exposure.
For example, USO has delivered a staggering -14.6% annualized return over the past decade. The culprit? Roll costs. When the spot price of oil is $24.09 and one-year futures trade at $32.65, rolling contracts lock in a 26% loss if spot prices stay flat. This structural flaw isn’t unique to oil: cocoa and natural gas ETFs face similar challenges.
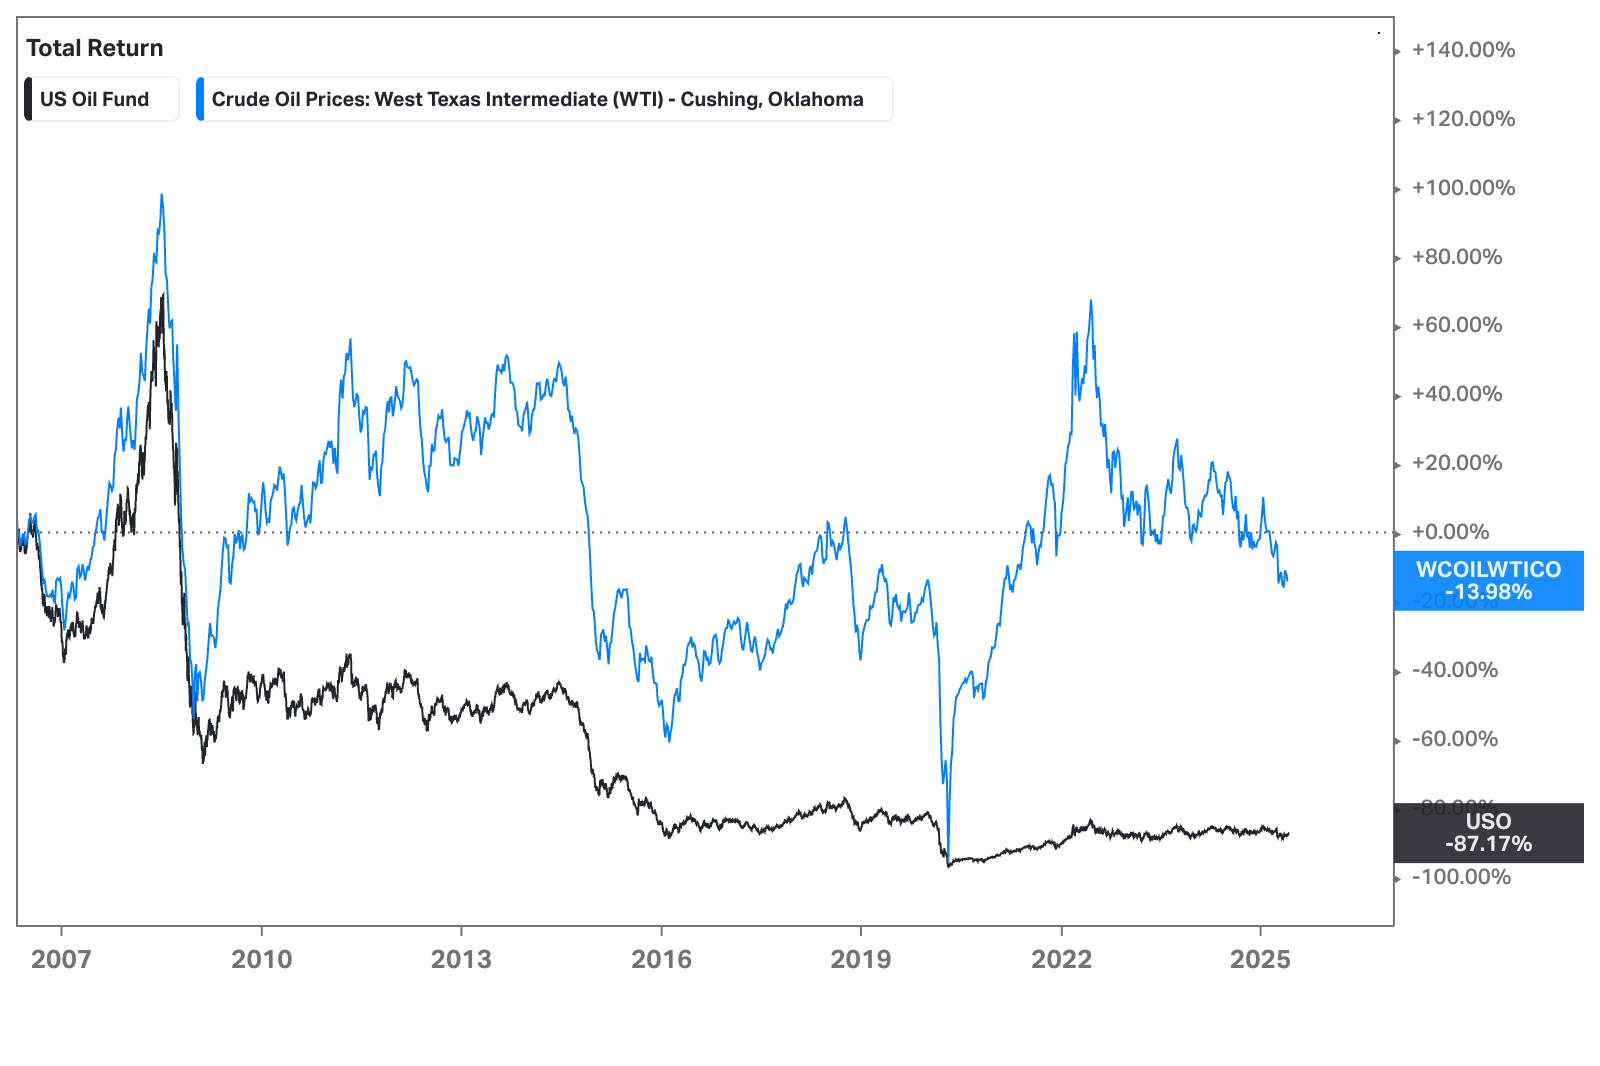
Below, we can see the USO ETF vs. the spot price of oil. Since 2007, oil prices have decreased by about 14%. USO has cratered almost 90%.
The Illusion of Commodity Exposure
Commodity ETFs often fail to track their underlying assets accurately. The Bloomberg Commodity Index has underperformed spot prices by 3-5% annually over the past 30 years due to roll costs and management fees. Even "optimized" ETFs like DBO, which selectively roll contracts to minimize losses, still lag behind physical commodities.
The disconnect is extreme in energy markets. During 2021–2022, USO gained just 40% while crude oil spot prices surged 80%. Gold ETFs like GLD often trail physical bullion due to storage fees and trading costs. These tracking errors make commodity ETFs poor tools for long-term buy-and-hold investors.
Commodities vs. Stocks: A Century of Underperformance
Over the long term, commodities pale next to equities. From 1872 to 2023, U.S. stocks returned 6.8% annually after inflation, while commodities eked out just 1.3%. The S&P 500 has outperformed the Bloomberg Commodity Index by 26,911% since 1970. Even during inflationary spikes like the 1970s, commodities only briefly outpaced stocks before reverting to underperformance.
Why the gap? Commodities lack earnings growth, dividends, or innovation, the engines that drive equity returns. They’re purely cyclical, rising and falling with supply shocks and macroeconomic trends.
My opinion here is to avoid investing in commodities and commodity ETFs.
Disclaimer:
The information provided in this article is for general informational purposes only and does not constitute investment, financial, legal, or tax advice. While every effort has been made to ensure the accuracy of the information, First Shelbourne makes no guarantees regarding its completeness or reliability. Readers should consult with a qualified financial advisor before making any investment decisions. Past performance is not indicative of future results. Investments involve risk, including the possible loss of principal. First Shelbourne is not responsible for any actions taken based on the information provided herein.